Overnight Shutdowns and Freezes: Reading a 0x154 Crash Dump

Finding a frozen machine in the morning does not mean the power went out or that it froze just then. Windows records what happened almost every time. If I know where to look, I can distinguish a blue screen from a power dip and make an informed guess about which part of the machine is involved.
1-minute summary
- Symptom / problem
- A laptop shuts down or freezes during overnight jobs, and it is unclear whether it was a power loss or a blue screen
- Who should read
- People whose Windows machine hangs or dies at night and who want the cause
- Fix in short
- Read the past logs for bugcheck codes 0x1A and 0x154, open MEMORY.DMP with kd, and rule out Intel XTU and XMP. The root cause is stated as not yet proven.
The gaming laptop I regularly use for overnight jobs froze, and I had to hold the power button to turn it off and back on in the morning. I had the logs checked for the previous two weeks instead of guessing whether power or software was to blame. The result was three shutdowns in fourteen days, all three caused by blue screens (bugchecks), not power failures.
This article describes how I read this kind of incident from logs and dumps, following what I actually did in early October. At the end, I state plainly that this case is still open. I do not know the root cause; I have only eliminated some variables. Some points were merely hypotheses that my assistant and I had at the time, and I will label them. I have left out the machine model and username, referring to it simply as a gaming laptop.
Step One: An Event Table Showing Why It Shut Down
If a machine shuts down on its own, the first question is whether the power failed or software/hardware crashed. These two cases leave different traces. If the power fails or the machine is forcibly powered off, Windows records only an unexpected shutdown (Kernel-Power event 41), without a cause. A blue screen, however, is followed by an event from WER-SystemErrorReporting at the next boot, along with a bugcheck code.
# ตัวอย่างทั่วไป: ดึง bugcheck ย้อนหลัง 14 วัน (PowerShell แบบ admin)
$since = (Get-Date).AddDays(-14)
Get-WinEvent -FilterHashtable @{
    LogName      = 'System'
    ProviderName = 'Microsoft-Windows-WER-SystemErrorReporting'
    StartTime    = $since
} | Select-Object TimeCreated, Id, @{n='Message';e={ $_.Message -replace '\s+',' ' }} |
  Format-Table -AutoSize -Wrap
This command uses standard Windows syntax; it is not output from my case. To check through the GUI, open Event Viewer and search the System log for Event ID 1001 (the bugcheck result) and 41 (Kernel-Power). This gives the same information.
The event table for this machine gave me three rows.
| Date | Time | Code | Name |
|---|---|---|---|
| 23 Sep. | 09:54 | 0x1A | MEMORY_MANAGEMENT |
| 29 Sep. | 18:51 | 0x154 | UNEXPECTED_STORE_EXCEPTION |
| 3 Oct. | 04:18 | 0x154 | UNEXPECTED_STORE_EXCEPTION |
The first incident had 0x41792 as its first parameter, which, according to the definition of bugcheck 0x1A, means a page table in memory was corrupted. The next two incidents both had 0x154. My only observation was that all three codes came from the memory subsystem, but I would not claim that 0x1A and 0x154 had the same cause. That was only a hypothesis.
If there is only an isolated Kernel-Power 41 event, with no WER-SystemErrorReporting event following it, that points to a power failure or power being cut while the machine was running. My case had bugcheck codes for all three incidents, so I could rule out power. But if your machine has only 41 events, check the power supply, plug, and adapter first.
A Morning Freeze and a Bugcheck at Four Are Not Always the Same Event
There is a detail here that I want to distinguish clearly. The last incident happened at 04:18, but I found the machine frozen in the morning, several hours later. My assistant at the time explained that what looked like a "freeze" was a static screen while Windows wrote the dump, and that the machine might remain on that screen until someone rebooted it. That sounds plausible, but I have to state that this is a hypothesis, not proof. I have no evidence that the machine actually froze on the dump screen. I only know that a complete dump file was there after rebooting.
A general fact about Windows is that, during a bugcheck, the screen can remain static while the system writes memory contents to disk, which can take a while if there is a lot of memory. But a gap of several hours still has several possible explanations, such as the machine finishing the dump and then waiting because automatic restart was not enabled. So all I can write is that the screen may remain static during a bugcheck, and the machine may stay on that screen until it is rebooted, without proving that this is what happened.
Step Two: Configure Dump Collection, Then Open It with kd
A dump is a snapshot of the machine's memory at the moment it crashes. Without the configuration in place, there is nothing to read. In System Properties > Advanced > Startup and Recovery, choose the type to save under Write debugging information. In this case, the file was C:\Windows\MEMORY.DMP, 4,318,318,535 bytes, approximately 4.3 GB, and it had been written in full.
I opened it with kd from Debugging Tools for Windows, the command-line version of WinDbg. I opened the file and ran the analysis.
# ตัวอย่างทั่วไป: เปิด dump แบบอ่านอย่างเดียว ไม่แตะไฟล์ต้นฉบับ
kd -z C:\Windows\MEMORY.DMP -c "!analyze -v; q"
# ตัวอย่างรูปแบบของผล !analyze -v — ไม่ใช่ผลเต็มของเคสนี้ แสดงเฉพาะบรรทัดที่ควรมองหา
*******************************************************************************
*                        Bugcheck Analysis                                    *
*******************************************************************************

UNEXPECTED_STORE_EXCEPTION (154)
...
BUGCHECK_CODE:  154
...
PROCESS_NAME:  MemCompression
...
I did not save the stack or the fields identifying the failure from the full kd output that time, so I will not guess at their contents. What I can confirm from the analysis is that the process involved was MemCompression, the Windows memory compressor that compresses old pages and keeps them in RAM instead of writing them to disk. The result pointed to the memory subsystem and the store, not the graphics driver. As for whether the underlying problem was physical RAM, an undervolt setting, or the disk holding the store, I still do not know.

What These Two Codes Can and Cannot Tell Me
Code 0x1A (MEMORY_MANAGEMENT) means the kernel's memory manager found something wrong, such as corruption in a structure used to manage pages. Code 0x154 (UNEXPECTED_STORE_EXCEPTION) concerns the store component, which manages storage of compressed or evicted pages. Both therefore fall in the same area, memory management, but the same area does not mean the same cause. The fault could be actual RAM failure, unstable voltage or frequency settings, the disk holding the page file, or a driver bug. The last two would normally leave traces in the stack, which I did not save.
MemCompression is a system process Windows uses to compress unused pages and keep them in RAM instead of immediately writing them to disk. If it is the process that crashes, something unexpected happened while reading or writing compressed data. This made me suspect memory first, but it is only a pointer, because the process shown in the analysis is the process running at the time of the crash, not necessarily the cause.
The dump type also affects what can be read. A kernel memory dump saves only kernel memory, while a complete memory dump saves the whole machine's memory and is close in size to the installed RAM. My file was 4.3 GB. I did not check which type it was in this case, so I will not claim either.
Eliminating Variables Without Causing Harm
Once I knew the evidence pointed to memory, I did two things to eliminate variables. The first concerned Intel XTU, an undervolt/overclock tool I had previously configured. I stopped its service (XTU3SERVICE, previously Running/Manual) and set it to Disabled so the old settings would not be reapplied at boot. One restart was required for this to take effect, because the settings applied by XTU remain in the CPU until a reboot.
# PowerShell แบบ admin: หยุดและปิดการสตาร์ตของ XTU service
Stop-Service XTU3SERVICE
Set-Service  XTU3SERVICE -StartupType Disabled
Get-Service  XTU3SERVICE | Format-List Name,Status,StartType

# ย้อนกลับถ้าต้องการใช้อีก
Set-Service  XTU3SERVICE -StartupType Manual
Start-Service XTU3SERVICE
The visible side effect was that the Overclock page in the manufacturer's tuning software no longer worked. Fan and thermal modes still worked because they are controlled through the BIOS rather than XTU.
The second was checking the RAM. This machine had two DDR5 modules, 16 GB each, running at 4800 to the JEDEC specification, their full advertised speed. There was no XMP profile to enable, so I could rule out "incorrect XMP settings." XMP is useful only when switching to RAM with a built-in profile.
Variables checked
- Power failure: ruled out because all three incidents had bugchecks
- Graphics driver: the process involved was MemCompression
- XMP: no profile; RAM runs at 4800 as specified
- XTU undervolt settings: service disabled
Unresolved variables
- Whether the RAM is actually faulty
- Whether the previous undervolt caused the crashes
- Whether the disk holding the store has a problem
- Whether disabling XTU stopped the symptoms; no follow-up results yet
What to Check If It Happens Again
The user decided to test the RAM themselves, but there are no memtest results in the notes yet, so I have nothing to cite. If it happens again, this is the sequence I would follow.
- Review the event table to see whether the codes are still in the memory group (0x1A, 0x154) or have changed to something else. A change would be a clue that the problem is not confined to one area.
- Open the new dump with
kdand check whether the process involved is still MemCompression. Save the stack this time. - Run a RAM testing tool from boot and let every pass finish without stopping it midway.
- If switching to RAM with an XMP profile, record the settings before enabling it so they can be traced later.
- If the codes stop appearing after disabling XTU, investigate what the old undervolt settings were before enabling it again.
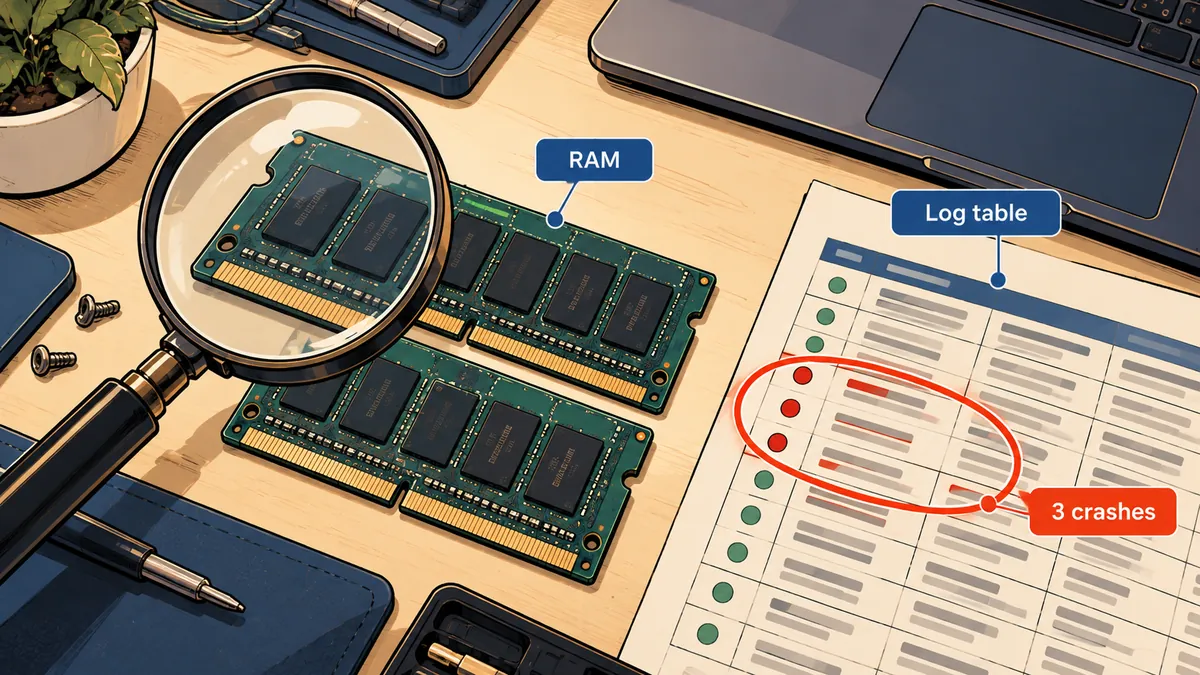
I still do not know the root cause: whether the RAM is faulty, the undervolt settings were wrong, or the disk holding the store has a problem. There has been no follow-up after disabling XTU to establish whether the symptoms stopped, and the hypothesis that 0x1A and 0x154 share a cause remains unproven. Everything here describes how to read the evidence and eliminate variables, not a fix that has been shown to work.
What I Took Away from This Case
Taking just the method forward, I can describe it as a short sequence. Always start with the event table, because it takes only a few minutes to tell whether power or a blue screen was involved. If it was a blue screen, check its code and name, because those alone can identify the likely area of the cause: memory, a driver, or disk. Then open the dump, check the process involved, and eliminate variables that can be removed without breaking anything, such as disabling a service that adjusts voltage. Another lesson I took away was to distinguish clearly between "what I observed" and "what my assistant or I guessed" from the moment I write the notes. Otherwise, after a while, a hypothesis becomes a fact in memory. Anyone with memtest results or a dump showing a different stack is welcome to compare them. If I have missed anything in my conclusions or made a typo, I will come back and correct it later.
Hit something like this? Stuck somewhere?
Come trade notes on the LinuxThai board

Comments 0
No comments yet — be the first