Diagnosing Intermittent Controller Link Faults with FINS Counters
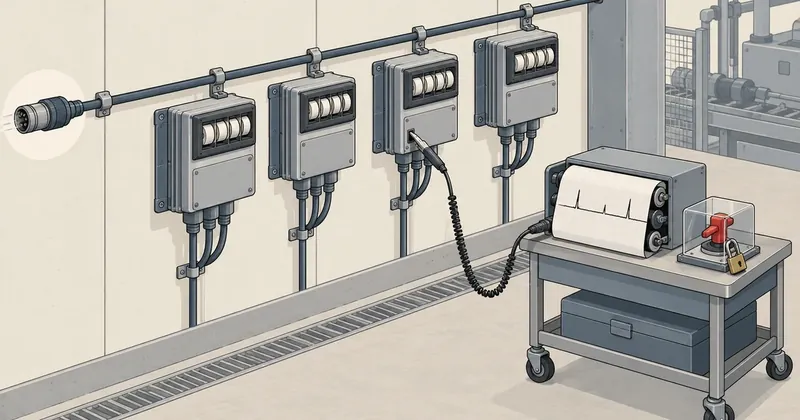
A network that drops out intermittently and recovers on its own always leaves traces in the communications unit's counters. The question is whether anyone reads and saves them before the next power outage.
1-minute summary
- Symptom / problem
- A Controller Link network drops out briefly and recovers on its own, and nobody keeps the evidence.
- Who should read
- Control engineers maintaining OMRON PLCs on a Controller Link network.
- Fix in short
- Send FINS commands with CMND(490) from the ladder, read the CRC, token timeout and data link counters every minute and compare the differences. Beware that FINS can stop other PLCs.
I was researching Omron PLC networks and set myself a question: if a Controller Link network drops out intermittently and recovers on its own, what could I use to track down the cause? At first, I assumed there would only be the LEDs on the front of the unit and the manufacturer's software to check, both of which would require someone standing at the cabinet just as the problem occurred. When I opened the Controller Link Units Operation Manual (W309-E1-12) and reached the commands chapter, I realized I was wrong. The unit itself responds to a set of FINS commands that provides a full set of diagnostic data, and those commands can be sent from the ladder logic of any PLC on the network. That means I can write a program to collect evidence continuously, without waiting for someone to go and watch.
Limitations to Know Before Reading
This entire article is based on reading the manual. I have not tried this on real equipment or sent any of these commands to a Controller Link unit. I transcribed the control word values and response byte positions from the diagrams in the manual. The Python examples run, but I have tested them only against data I made up. Page references are PDF page numbers for W309 revision E1-12. Newer or older unit models may differ in detail, so open the manual for the exact model before using this.
FINS has more than read commands. The same set includes commands to stop data links across the entire network and to change the destination CPU's mode to PROGRAM, which changes the state of the outputs on the machinery controlled by that PLC. Testing any commands on a network connected to real machinery requires permission from the person responsible for that machinery and should be supervised by a qualified engineer. This article is a record of my reading of the manual, not a tested procedure.
The 11 FINS Commands the Controller Link Unit Responds To
Section 6-5 of W309 lists 11 commands the unit accepts. Each command code is 2 bytes. I have reorganized them by what they return and used a separate color for commands that change network state or delete data, to distinguish them from read-only commands.
The table in the manual has two more columns showing which commands can be used while data links are running or stopped. All read commands work in both states. DATA LINK START works only while data links are stopped, and DATA LINK STOP works only while data links are running. Sending one at the wrong time returns an error. One detail worth knowing: the node that receives DATA LINK START becomes the startup node for that data link run.
What the Counters Tell Me: Cable Problems Versus Node Problems
The most useful command for intermittent dropouts is 06 01 CONTROLLER STATUS READ. Its response contains 8 counters, each 1 byte long.
| Counter | What it counts | What an increase points to |
|---|---|---|
| Count 1 | CRC error | Cable, connectors, terminating resistors, interference |
| Count 2 | token re-send | No confirmed information yet |
| Count 3 | token return | No confirmed information yet |
| Count 4 | token timeout | Cable and terminators, as with CRC |
| Count 5 | polling timeout | No confirmed information yet |
| Count 6 | controller change | No confirmed information yet |
| Count 7 | active node change | Nodes joining or leaving the network |
| Count 8 | Reserved | Unused |
The two cases in the rightmost column that I am confident about are increasing CRC error and token timeout counts pointing to the physical layer—cable and terminators—and increasing active node change counts pointing to a node repeatedly joining and leaving, for example because of a supply voltage dip or a CPU restart. I left the other rows open because I do not yet have real data confirming which situations cause each counter to move, and I do not want to guess from the names. The manual also includes model-specific notes: CLK23 does not use Count 5, and units for some older PLC models do not use Count 7.
CRC error and token timeout increase
Suspect the cable, connectors, and terminating resistors first. The same response includes status bytes reporting the configured speed and that unit's terminating resistor status, so I can also check whether a node in the middle of the cable has its terminator left on, without walking over to open the cabinet.
active node change increases
If the CRC counter stays still but nodes are joining and leaving, read 06 02 next. It provides per-node status showing which nodes are absent from the network, whether they left normally or abnormally, and which are not responding to polling.
The next command, 06 02 NETWORK STATUS READ, gives a picture of the whole network. It returns network participation status at 4 bits per node, actual communications cycle time in units of 100 microseconds, the number of the current polling node, per-node continuous data link reception error status, and per-node data link reception error counters, each 1 byte long, counting from 0 to 255 and accumulating since power-on. That last set of counters answers a question 06 01 cannot: which node's data is affected?
The 06 03 DATA LINK STATUS READ command returns both the current and maximum refresh cycle times for the data link area, in units of 1 millisecond over a range of 0 to 255, along with the same per-node status the PLC sees in memory. The maximum refresh cycle time is useful because it remembers for me. If one cycle takes abnormally long, the maximum remains visible even if everything has returned to normal by the time I read it.
A note at the end of command 06 03 on W309 page 235 says: Any node which is not active in the network retains the status that existed immediately prior to the generation of the communications error. The status read for a disconnected node is therefore its status before the problem, not its current status. The bit indicating that the node's program is running may still be 1 even though the equipment has lost power. Always read it together with the communications error bit and network participation status. The preceding note on the same page also says that data link status is not refreshed while data links are stopped.
Sending from Ladder Logic with CMND(490)
All these commands can be sent from the PLC program using CMND(490), which takes 3 operands. S is the first word of command data, D is the first word where the response will be stored, and C is the first word of control data. For CS/CJ PLCs, the control data occupies 6 words, C through C+5, as shown in section 6-1-2 of W309.
There were three points I nearly misread. First, the unit address in C+3 must be FE to address the Controller Link unit. If it is 00, the command goes to that node's CPU instead, where the same command code has a different meaning. Second, bit 15 of C+4 being 0 means a response is required, while 1 means it is not—the reverse of my initial guess. Third, setting the response timeout in C+5 to 0000 gives the default of 2 seconds, but the manual warns that too small a value causes errors at low network speeds and gives typical values of about 4 seconds at 1 Mbps or 8 seconds at 500 kbps.
def cmnd_control(cmd_bytes, resp_bytes, node, unit=0xFE, net=0,
                 port=7, retries=3, wait_s=4.0, need_resp=True):
    """สร้าง control word C..C+5 ของ CMND(490) สำหรับ CS/CJ ตามผังใน W309 หัวข้อ 6-1-2"""
    assert 0 <= cmd_bytes <= 1990 and 0 <= resp_bytes <= 1990
    assert 0 <= net <= 127 and 0 <= port <= 7 and 0 <= retries <= 15
    c4 = (0x0000 if need_resp else 0x8000) | (port << 8) | retries
    return [cmd_bytes, resp_bytes, net, (node << 8) | unit, c4, round(wait_s * 10)]

# อ่าน CONTROLLER STATUS (06 01) จากตัว Controller Link unit ของโหนด 2
words = cmnd_control(cmd_bytes=2, resp_bytes=27, node=2)
print(' '.join(f'{w:04X}' for w in words))
# 0002 001B 0000 02FE 0703 0028
The 27-byte response length comes from counting the fields in the diagram for command 06 01: 2 bytes for the command code, 2 bytes for the response code, 1 byte for operating status, 6 bytes for status, 8 bytes for counters, and 8 bytes for the list of nodes in the network. Laid out in PLC memory, it would look roughly like this.
คำสั่ง    @CMND(490)   S = D01000   D = D01100   C = D01010

D01000   0601    รหัสคำสั่ง CONTROLLER STATUS READ
D01010   0002    C     จำนวนไบต์ของคำสั่ง
D01011   001B    C+1   จำนวนไบต์ของ response ที่รอรับ (27)
D01012   0000    C+2   เครือข่ายปลายทาง 00 = เครือข่ายตัวเอง
D01013   02FE    C+3   โหนด 2, unit FE = ยูนิตที่ต่อกับเครือข่าย
D01014   0703    C+4   ต้องการ response, port 7, ส่งซ้ำ 3 ครั้ง
D01015   0028    C+5   รอ response 4.0 วินาที

ก่อนสั่ง   A202.07 ต้อง ON     (port 7 ว่าง)
หลังจบ    A219.07 ON = จบแบบผิดปกติ,  A210 = completion code ของ port 7
The three groups of flags at the end of the table must always be included in the program's interlocks. The Communications Port Enabled Flags at A202.00 through A202.07 indicate whether ports 0 through 7 are free. The flag must be ON before issuing a command because each port can handle only one command at a time. The Communications Port Error Flags at A219.00 through A219.07 indicate that the port's last command ended abnormally, and the Completion Codes at A203 through A210 store the result code in 1 word per port. The manual stresses another point: the message service does not guarantee delivery to the destination, so always set the retry count to a value other than 0. SEND(090) and RECV(098) use a similar control word layout but have 5 words because there is no response byte count field.
Read Every Minute and Compare the Differences
A counter on its own says little. A CRC error count of 40 might have accumulated over three months or appeared in the last ten minutes. The approach I propose is therefore to read periodically and store the differences.
- Have one PLC on the network send 06 01 and 06 02 every minute, storing each response as a row in DM with a timestamp.
- Calculate the difference between each counter and its previous reading. A nonzero difference represents events during that minute.
- If CRC error or token timeout increases, record the time to compare with events on site, such as which machine started then.
- If active node change increases, check the per-node status in 06 02 to see which node disappeared.
- When a node's data link status drops, immediately send 08 01 ECHOBACK TEST to that node.
- Read and save 21 02 ERROR LOG READ periodically, before older entries are overwritten.
Step 5 separates two causes that look the same from the outside. Echoback sends up to 1,998 bytes of test data to the destination node, which returns every byte unchanged, without touching the data link. If echoback passes but that node's data link is not working, the communications path is working normally and the problem is in the data link configuration, such as an incorrect data link table. If echoback also fails, the node really is unreachable. The response-code troubleshooting table in section 6-7 of the manual recommends the same approach: when a code indicates that the retry count has been exceeded, check communications using ECHOBACK TEST.
The analysis code can be very short. I wrote it in Python to make the byte positions visible. In a PLC, it would just be subtraction of values in DM. The two sample data blocks in the code are made up, not responses from real equipment.
NAMES = ['crc_error', 'token_resend', 'token_return', 'token_timeout',
         'polling_timeout', 'controller_change', 'active_node_change', 'reserved']

def parse_0601(raw):
    """response ของ 06 01: รหัสคำสั่ง 2 + response code 2 + สถานะ 1 + 6 + ตัวนับ 8 + โหนด 8"""
    if len(raw) != 27 or raw[0:2] != bytes([0x06, 0x01]):
        raise ValueError('ไม่ใช่ response ของ 06 01')
    mres, sres = raw[2], raw[3]
    if mres & 0x80:
        raise RuntimeError('network relay error คำสั่งไปไม่ถึงปลายทาง')
    if (mres & 0x7F, sres & 0x3F) != (0, 0):
        raise RuntimeError(f'response code {mres:02X}{sres:02X}')
    return dict(zip(NAMES, raw[11:19]))

def delta(prev, now):
    # ตัวนับกว้าง 1 ไบต์ โค้ดนี้สมมติว่าเต็ม 255 แล้ววนกลับ 0 ซึ่งผมยังไม่ได้พิสูจน์
    return {k: (now[k] - prev[k]) % 256 for k in now if k != 'reserved'}

head = bytes([0x06, 0x01, 0x00, 0x00, 0x01]) + bytes(6)      # ข้อมูลสมมติ
t0 = parse_0601(head + bytes([3, 0, 0, 1, 0, 0, 2, 0]) + bytes(8))
t1 = parse_0601(head + bytes([9, 1, 0, 4, 0, 0, 2, 0]) + bytes(8))
print({k: v for k, v in delta(t0, t1).items() if v})
# {'crc_error': 6, 'token_resend': 1, 'token_timeout': 3}
This example result means that, in one minute, CRC error increased by 6 and token timeout by 3, while active node change stayed unchanged. According to the table above, that means checking the cable before the nodes.
I need to stress the counter wraparound issue. The manual says only that each counter returns 1 byte; that page does not say whether it saturates at 255 or wraps around. If it saturates, the difference will remain zero afterward, and the program will report normal operation when that is not the case. I should therefore also raise an alert when any value reaches 255 until I can test this on real equipment. For the error log, the manual specifies a maximum of 39 entries for CLK21 and 64 entries for CLK23. Each entry is 10 bytes long and contains an error code, details, and the date and time of occurrence. If there are no entries, response code 1103 is returned, which is not a communications failure.
Response Codes and Network Relay Errors
Every response starts with the command code that was sent, followed by a 2-byte response code. The first byte, MRES, identifies the result category; the second, SRES, gives the details. A value of 00 00 means normal completion. The categories commonly encountered in diagnostics, according to the table in section 6-4, are as follows.
| MRES | Meaning |
|---|---|
| 00 | Normal completion |
| 01 | Local node error |
| 02 | Destination node error |
| 03 | Communications controller error |
| 04 | Destination does not support this command |
| 05 | routing error |
| 10 | Incorrect command format |
| 11 | Incorrect parameter |
| 22 | Cannot execute in the current mode |
According to section 6-7-1, three special bits are embedded in the response code. Bit 7 of the first byte is the Relay Error Flag. If it is ON, a network relay error occurred: the command did not reach its destination because it was blocked at an intermediate unit or network. In this case, 2 additional bytes follow the response code, giving the network and node numbers of the point where forwarding failed, so I can trace where it got stuck. Bits 6 and 7 of the second byte are flags indicating that the responding PLC has a nonfatal or fatal error. When checking for normal completion, I therefore need to mask out these bits before comparing with zero, as in the parse_0601 function above.
The Risk: FINS Can Stop Other PLCs
This section is why I could not leave this article at just how to read the data. In the unit's own command table, 04 01 and 04 02 can start and stop data links across the entire network from any node participating in the data link, and 21 03 clears the entire error log, destroying the evidence.
More seriously, the same code means different things depending on the destination. With a unit address of FE, code 04 02 is DATA LINK STOP. With a unit address of 00, it is sent to the CPU, and code 04 02 is the STOP command. W309 section 6-6-9 describes this for C200HX/HG/HE and CQM1H PLCs as changing the PLC to PROGRAM mode and stopping program execution. For CS/CJ, the manual refers to the FINS Commands Reference Manual (W227), which I have not yet read. However, the Message Service chapter of the training material I read includes an example of using CMND to send 0402 to node 2, after which node 2's CPU changes to PROGRAM mode. In other words, changing just one byte in the control words turns a command to stop data links into a command to stop an entire PLC.
I propose separating read operations from control operations at the program structure level, documenting that as a project policy, and checking every program on the network against it.
fins_policy:
  read_only:                # ใช้ในงานวินิจฉัยได้ ไม่เปลี่ยนสถานะเครือข่าย
    - "05 01"               # CONTROLLER DATA READ
    - "06 01"               # CONTROLLER STATUS READ
    - "06 02"               # NETWORK STATUS READ
    - "06 03"               # DATA LINK STATUS READ
    - "08 01"               # ECHOBACK TEST
    - "08 02"               # BROADCAST TEST RESULTS READ
    - "21 02"               # ERROR LOG READ
  needs_written_approval:   # ต้องมีผู้อนุมัติและอยู่ในบล็อกแยก มีกุญแจสั่งด้วยมือ
    - "04 01"               # DATA LINK START
    - "04 02"               # DATA LINK STOP และ STOP ของ CPU เมื่อ unit = 00
    - "08 03"               # BROADCAST TEST DATA SEND
    - "21 03"               # ERROR LOG CLEAR
  rules:
    - บล็อกวินิจฉัยใช้ unit address FE คงที่ ห้ามรับค่าจากตัวแปร
    - รหัสคำสั่งเป็นค่าคงที่ในโปรแกรม ห้ามให้ HMI เขียนลง word คำสั่งโดยตรง
    - CMND ทุกตัวในเครือข่ายต้องมีรายการว่าอยู่ในโปรแกรมไหน ส่งรหัสอะไร ไปโหนดไหน
The first rule in the file comes directly from the unit address issue above. If the diagnostic block takes its unit address from a variable writable by the HMI or another part of the program, and that value becomes 00 one day, a block intended only to read status will send commands to the CPU instead. I put the broadcast test in the approval-required category because it sends data to all nodes simultaneously. Although the manual calls it a test command, I do not yet know its effect on the communications cycle of a network in operation, so I do not want to make it freely available.
Conclusion
The Controller Link unit has a full set of built-in diagnostic tools: cable-related counters, actual cycle times, per-node status, an error log, and a path test that does not touch the data link. All can be sent from ladder logic using CMND(490). If the network drops out intermittently, collecting counter differences every minute can indicate whether the problem is with the cable or a node, without someone watching the cabinet. But the same channel can stop data links and other PLCs, so read operations must be separated from control operations, and I need a complete picture of which programs on the network use CMND.
If I get to work on a network like this myself, I will start with just 06 01 and 21 02, because they are read-only and provide information that LEDs cannot. How much I add after that will depend on the size of the network. The supplementary training material I used dates from 2007, and newer models have additional capabilities, so I have used the section and page numbers in W309 revision E1-12 as my main reference. Once I have tested this on real equipment, if any byte positions or counter behavior differ from what I transcribed, I will come back and update the article.
Hit something like this? Stuck somewhere?
Come trade notes on the LinuxThai board

Comments 0
No comments yet — be the first